You are here : At Home > Water resources > Central
Central Region
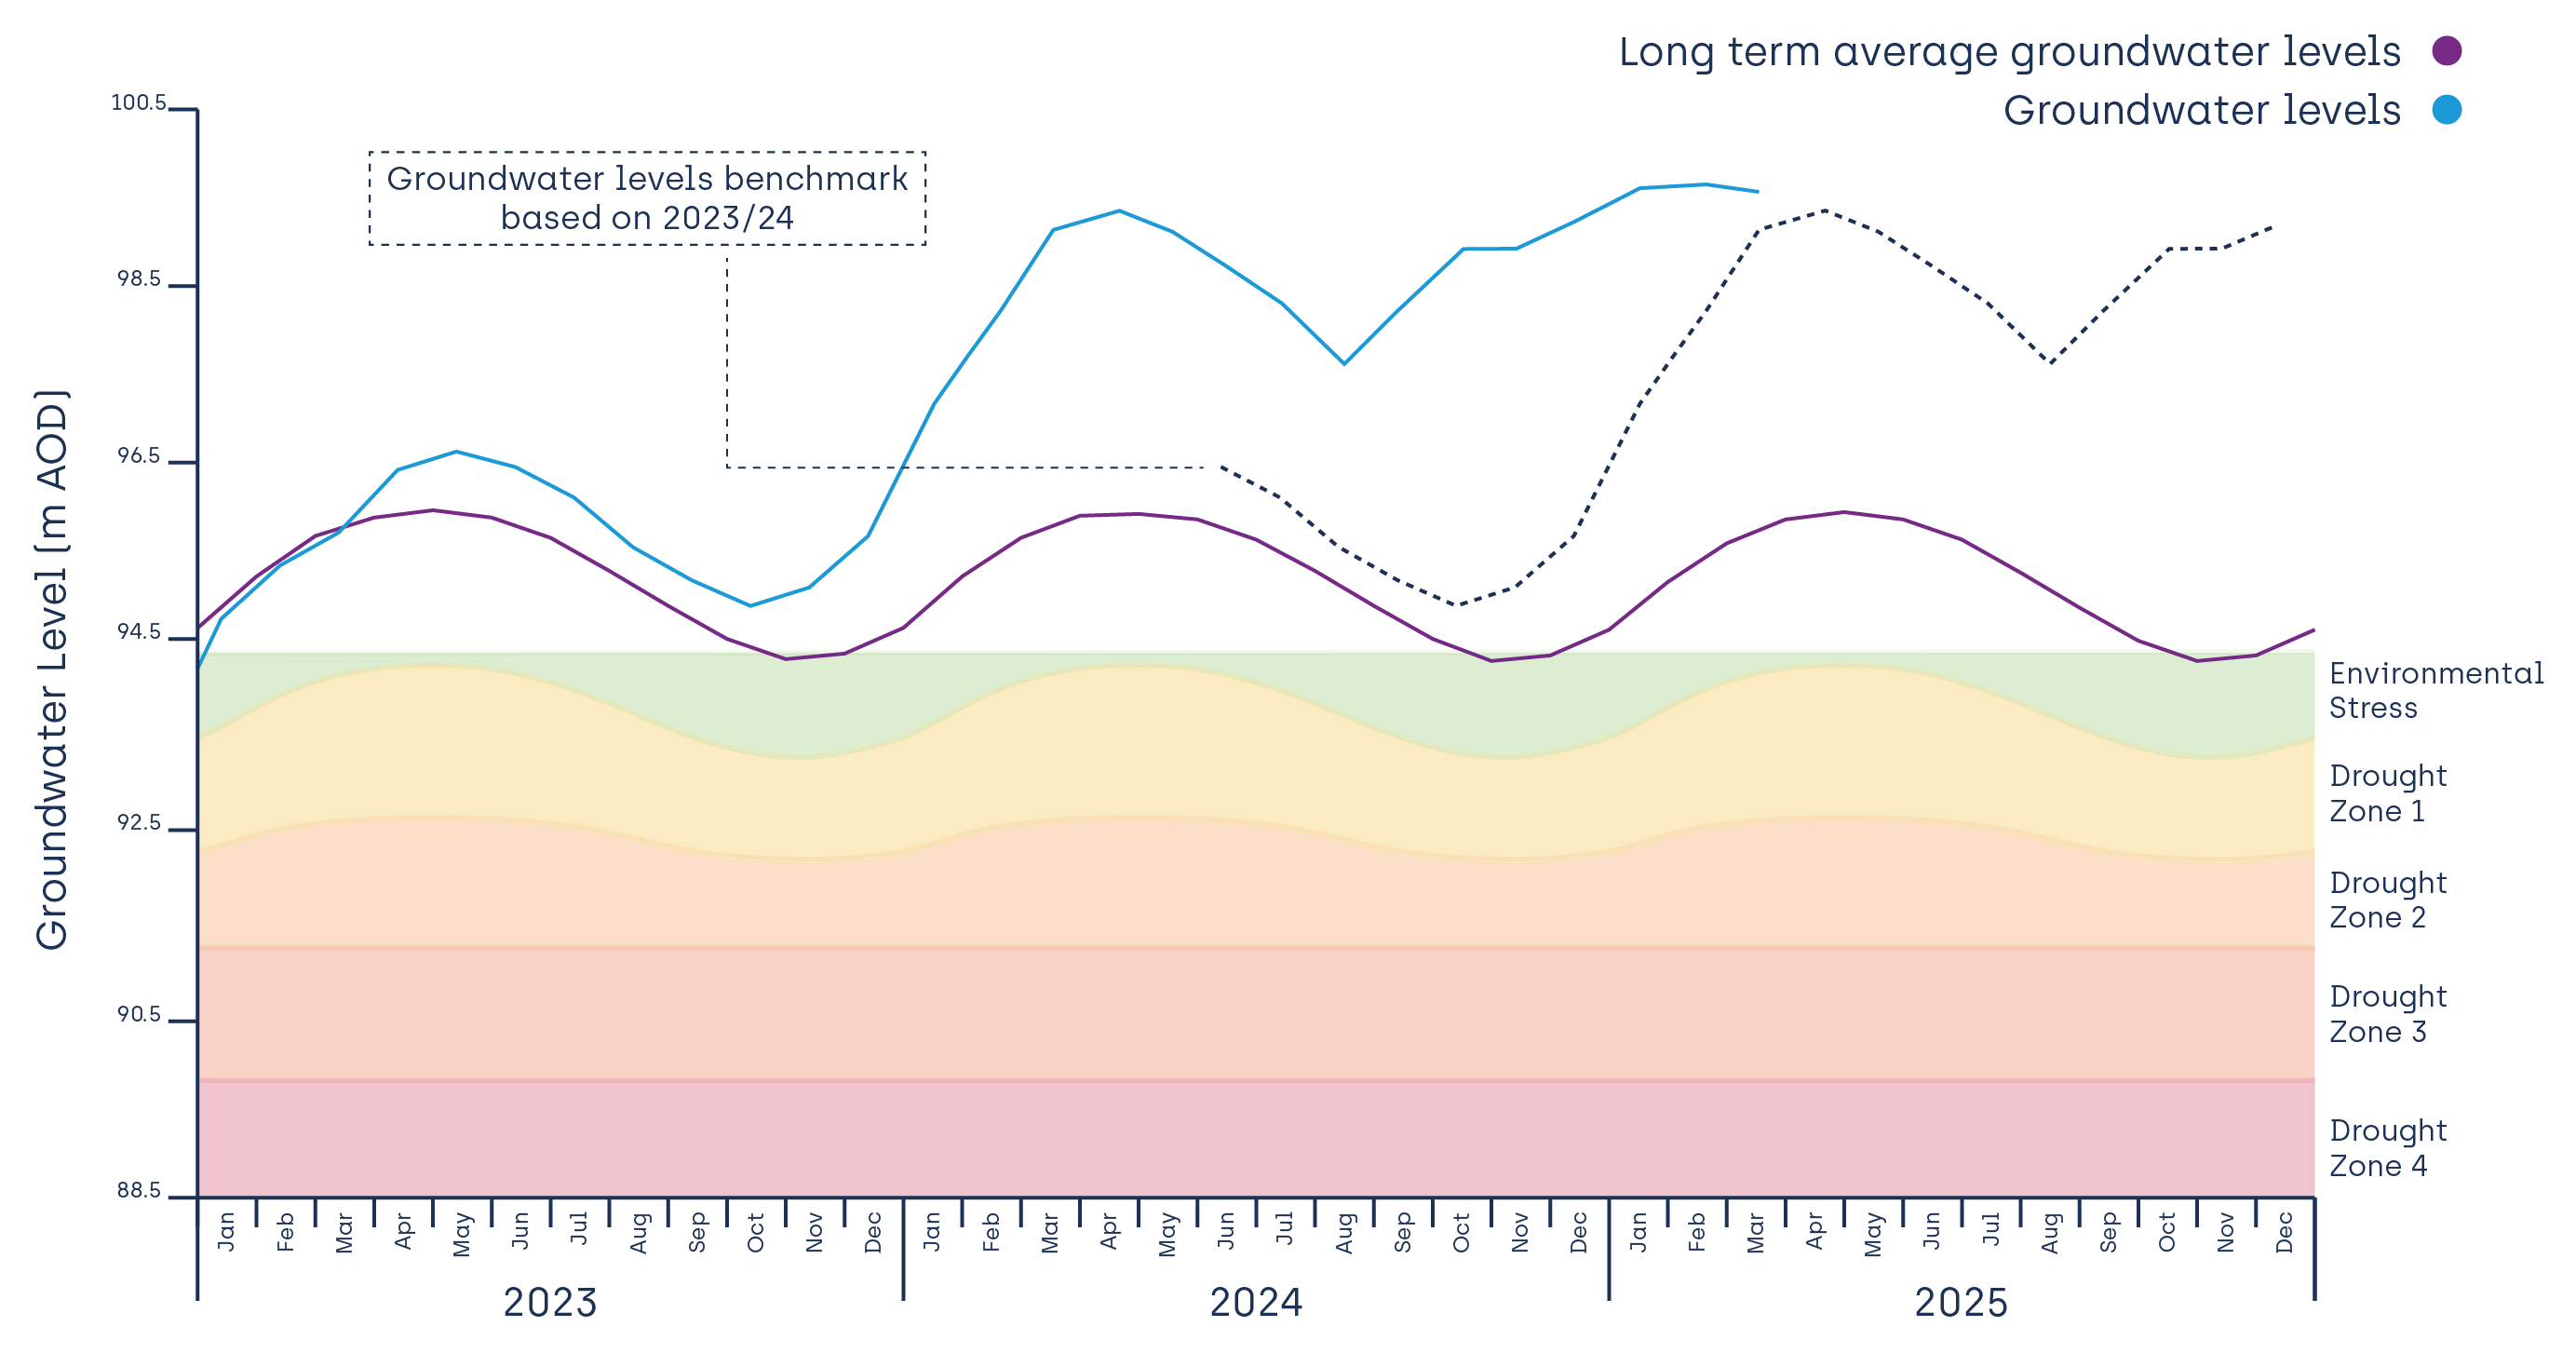
*The long term average (LTA) has been calculated statistically, using the long term data record for this hydrograph. The respective drought zones are used as operational triggers and have been derived using the LTA.
Rainfall in our Central region was well below average in February at 26% of the Long Term Average (LTA). Over the last three months (January to March inclusive), our Central region has received below average rainfall (77% of the LTA) and below average effective precipitation (88% of the LTA). Soil Moisture Deficit (SMD) is now well above average levels for the time of year, meaning any forthcoming rainfall is unlikely to contribute to groundwater recharge.
Groundwater levels started to decrease in March due to below average rainfall and effective precipitation during February and March. Groundwater levels however are likely to remain above average over the next six months if rainfall is greater than 60% of the LTA. Groundwater levels are currently in a higher position than the above average conditions experienced in 2013-14 and 2020-21 but in a lower position than 2000-01 at the end of March.
Please refer to our Drought Plan for further information about droughts and how we manage them.