You are here : At Home > Water resources > East
East Region
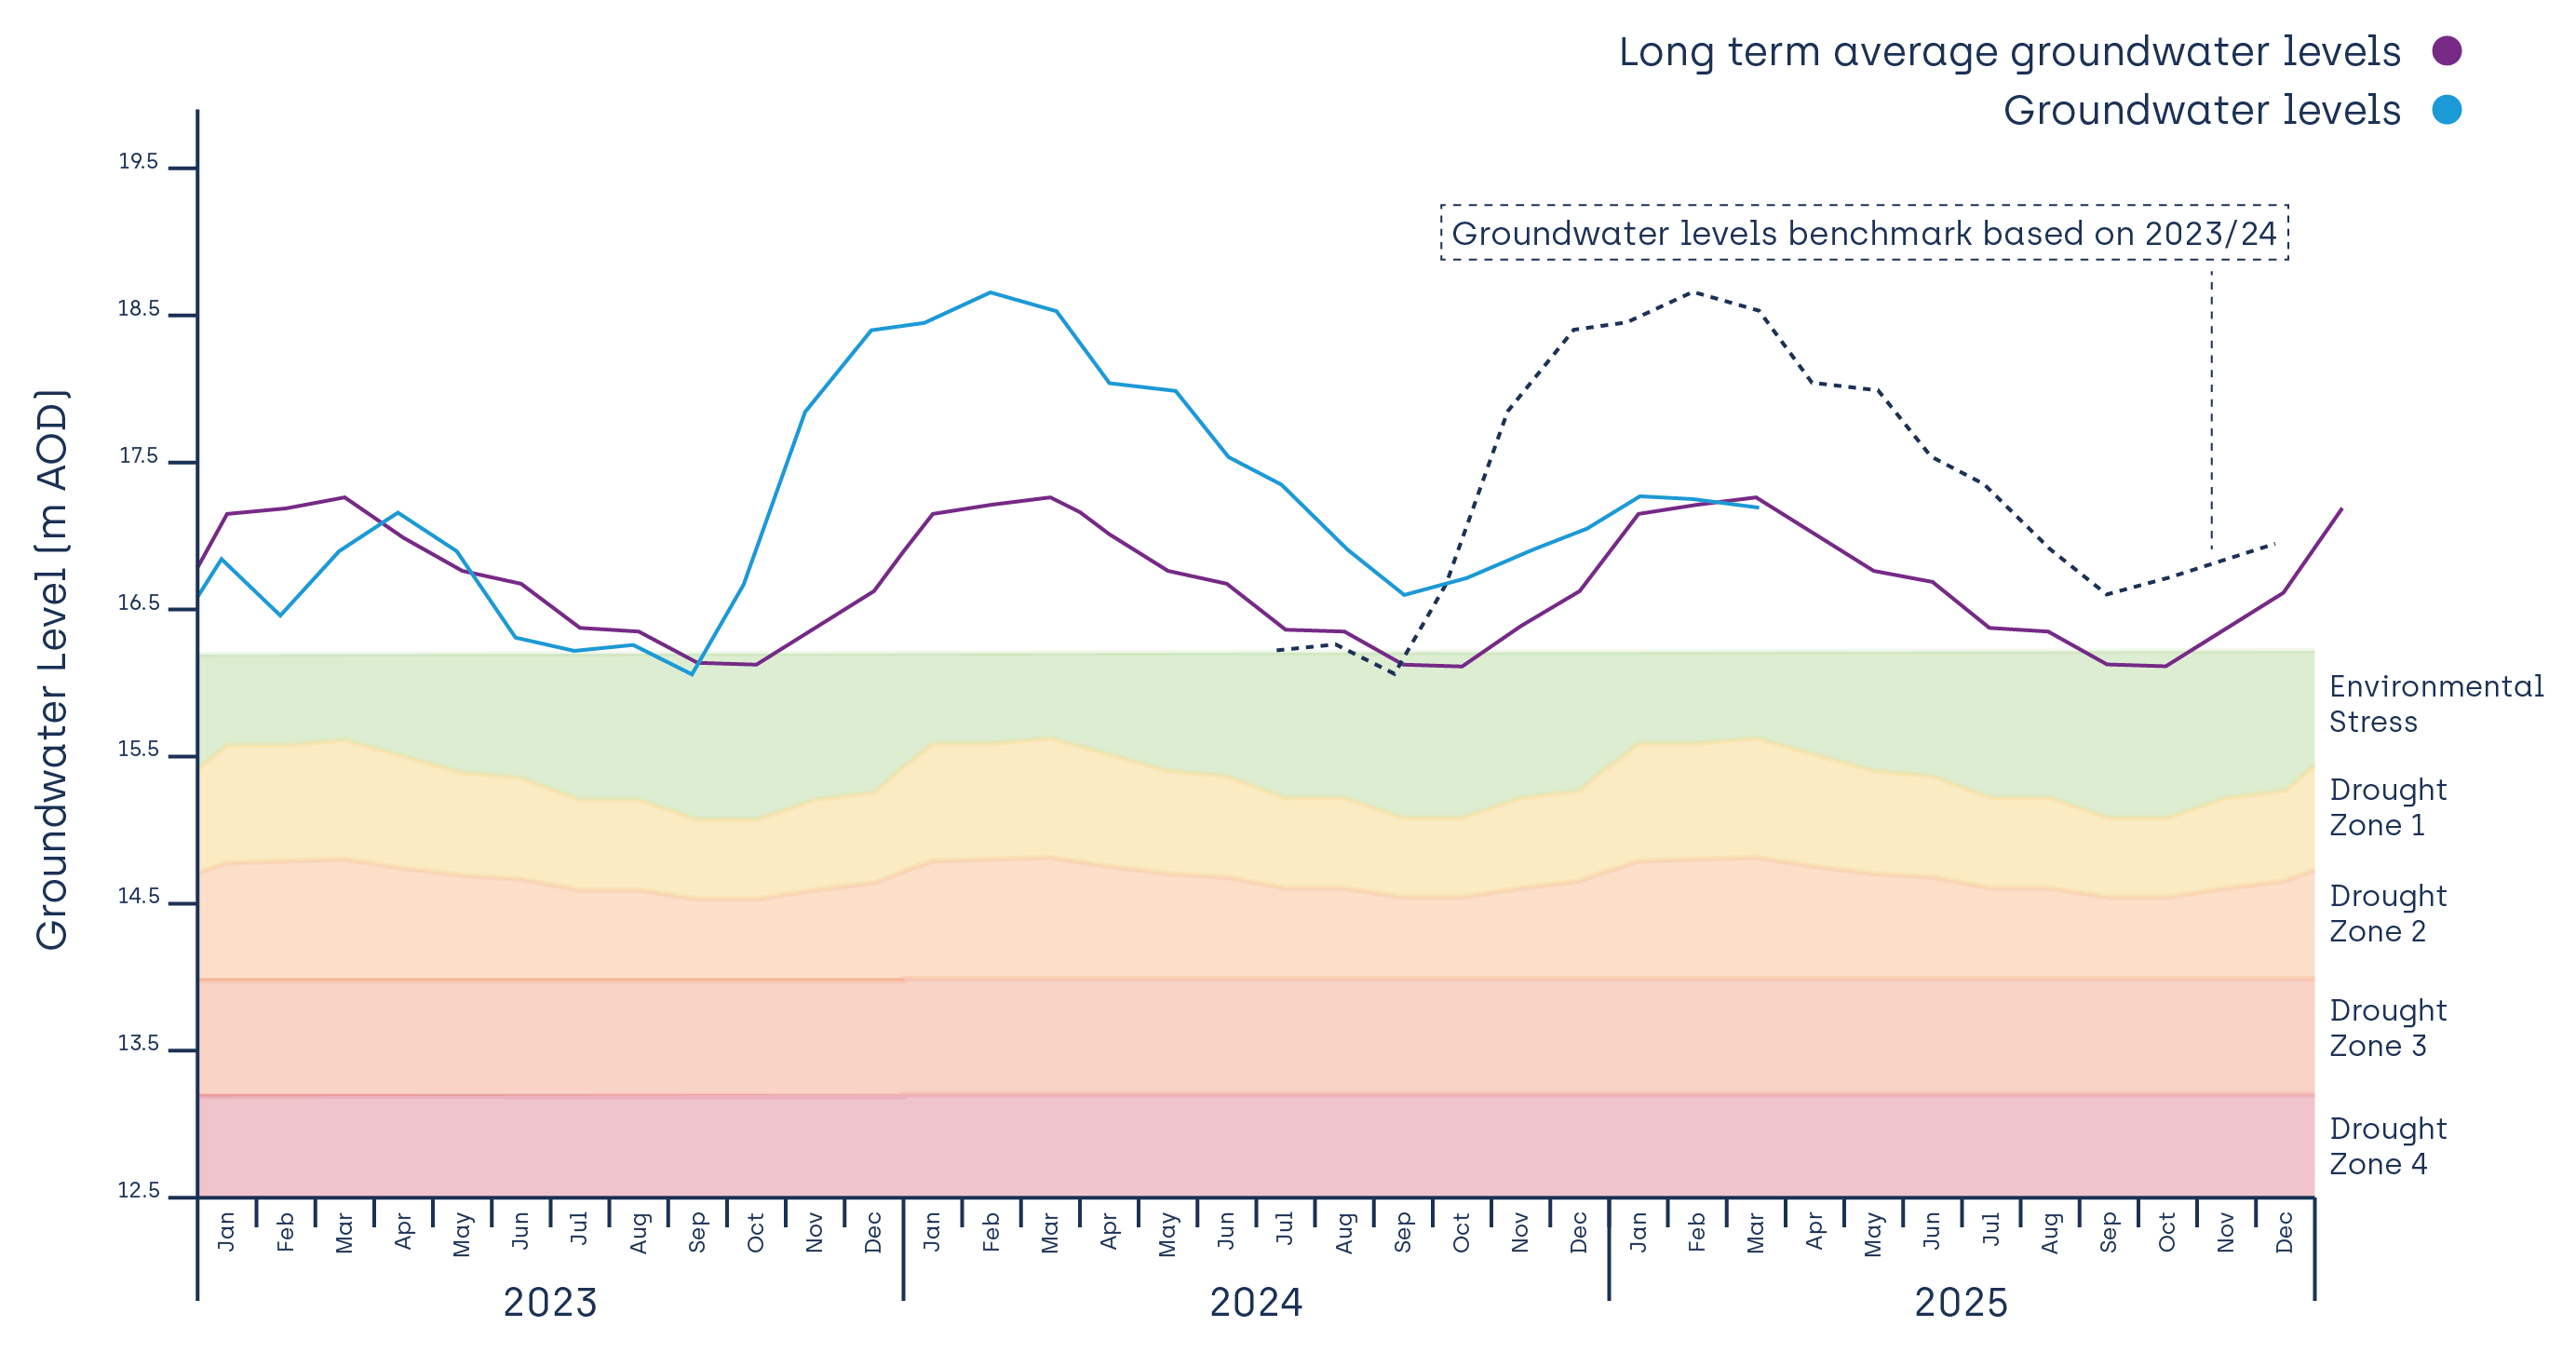
*The long term average (LTA) has been calculated statistically, using the long term data record for this hydrograph. The respective drought zones are used as operational triggers, and have been derived using the LTA.
Rainfall in our East region was well below average in March at 24% of the Long Term Average (LTA). Over the last three months (January to March inclusive), our East region has received below average rainfall (74% of the LTA) and below average effective precipitation (81% of the LTA). Soils wetness (SMD) is now well above average, meaning any forthcoming rainfall is unlikely to contribute to groundwater recharge.
Groundwater levels started to decrease through February and remain below average due to the below average rainfall and effective precipitation in February and March. Groundwater levels are likely to remain below average over the next six months.
Please refer to our Drought Plan for what this means for us and our customers.